
Key Takeaways
- AMD shares jumped about 10% on Monday, Sept 21, 2026, to a record close of $615.52 — market cap above $1 trillion for the first time.
- That close sits about 8.9% above the roughly $565 average analyst target MarketBeat showed on Sept 16, 2026, but about 0.5% below S&P Global’s $618.51 average (Sept 30). The average depends on who is counted.
- A forward P/E of about 72 (Investing.com, Sept 21) against roughly 158 on trailing GAAP earnings (our math) means earnings per share must rise about 2.2x, or about 1.5x on a non-GAAP base.
Whether AMD is priced above its analysts’ average target depends on which average you use. Against MarketBeat’s it is about 9% above; against S&P Global’s it is roughly level. Neither is a crash signal. Both show a market moving faster than the estimates built around it.
What Actually Happened Monday
The move was not a single-company surprise. AMD rode a five-day winning streak into Monday, up roughly 25% over that stretch, on the same AI-demand wave lifting the rest of the chip sector. Data center revenue rose 107% year over year to $6.7B in Q2, per AMD’s release.
CNBC reports that CEO Lisa Su said on last month’s earnings call that AMD expects to double data center sales in 2027. We covered AMD’s Q2 2026 earnings in detail here — every number beat, and the stock still closed about 7% lower.
Monday’s rally is the opposite pattern: no single new number, just the market re-rating a growth story it already had.
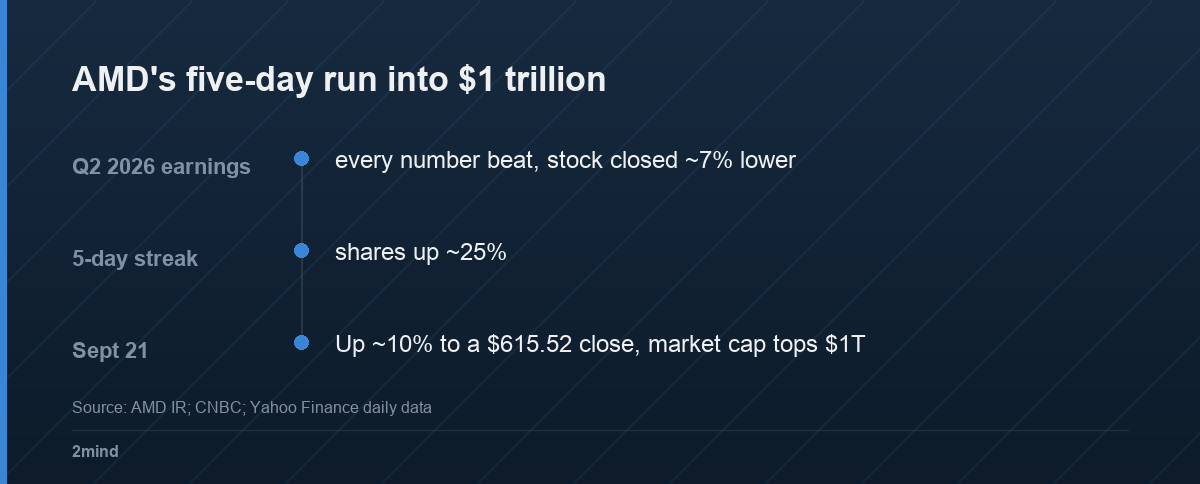
The five-day, +25% run ended on a day with no distinct trigger of its own — which is part of what the checklist below is for.
The AMD Valuation Checkpoint
| Metric | Value | Context |
|---|---|---|
| Share price, Sept 21 close | $615.52 | Record high, +9.95% that day |
| Avg. analyst target, MarketBeat (Sept 16) | about $565 | ~8% below the Sept 21 close |
| Forward P/E (Investing.com, Sept 21) | ~72x | Trailing ~153x on Investing.com; ~158x on our math |
| Q2 2026 revenue growth, YoY | +50% | $11.54B quarterly revenue |
A forward P/E of 72 means the market is paying 72 years of today’s expected annual earnings for one share — a bet that earnings keep compounding, not a statement about today’s business.
Does the Average Target Say AMD Is Overvalued? It Depends on the Source
Analyst average targets differ by data provider because each counts a different set of analysts. Figures below were retrieved October 2, 2026. AMD’s September 21 close was $615.52.
| Source and date | Average target | Sept 21 close vs. target |
|---|---|---|
| MarketBeat, via FX Leaders (Sept 16) | about $565 | 8.9% above |
| MarketBeat (Oct 1; 47 analysts; range $235 to $1,250) | $567.63 | 8.4% above |
| S&P Global, via StockAnalysis (Sept 30; 55 analysts; median $616; range $365 to $1,250) | $618.51 | 0.5% below |
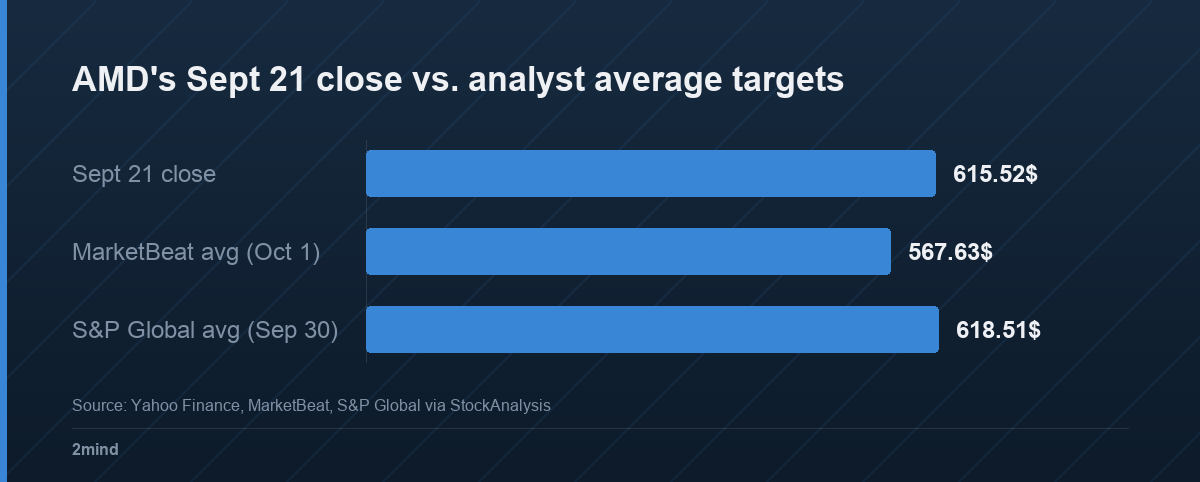
The spread is why an average target is a weak signal alone. Our reading: treat it as one input, and check which analysts are counted before calling a stock above or below consensus.
What the P/E Numbers Imply About Earnings Growth
A forward P/E divides price by expected earnings per share (EPS); a trailing P/E divides by reported EPS. At one price, the ratio of the two is the EPS growth the market is paying for. Inputs and dates are below.
| Input | Value | Source and date |
|---|---|---|
| AMD share price | $615.52 | Yahoo Finance daily close, Sept 21, 2026 |
| EPS, last four reported quarters, GAAP | $3.89 | AMD results, Q3 2025 to Q2 2026: 0.75 + 0.92 + 0.84 + 1.38 |
| EPS, same quarters, non-GAAP | $5.76 | AMD results: 1.20 + 1.53 + 1.37 + 1.66 |
| Forward P/E | 72.4x | Investing.com, Sept 21, 2026 (labelled “as of Dec 31, 2026”) |
| Step | Calculation | Result |
|---|---|---|
| Trailing P/E, GAAP | 615.52 ÷ 3.89 | 158x |
| Trailing P/E, non-GAAP | 615.52 ÷ 5.76 | 107x |
| Implied forward EPS | 615.52 ÷ 72.4 | $8.50 |
| Implied EPS growth, GAAP base | 8.50 ÷ 3.89 | 2.2x (+119%) |
| Implied EPS growth, non-GAAP base | 8.50 ÷ 5.76 | 1.5x (+48%) |
The page does not say whether its forward EPS is GAAP or non-GAAP, so we show both. Either way, the multiple needs EPS to rise by roughly half to more than double. Investing.com’s own trailing P/E, 153.0x labelled as of June 30, is an older snapshot than our 158x.
Cross-check: S&P Global consensus on StockAnalysis (Sept 30) shows 2026 non-GAAP EPS of $7.58, up 81.7% from AMD’s reported $4.17 for 2025, and $15.58 for 2027. At the Sept 21 close that is about 81x and 39.5x. Providers’ forward P/Es differ because their estimates and periods differ.
One caution on growth rates: AMD says Q2 2025 non-GAAP EPS of $0.48 included $800M of inventory and related charges tied to export controls, so Q2 2026’s +246% flatters the trend. Q1 2026 non-GAAP EPS grew 43%.
This is analysis of public figures, not investment advice.
Four Questions Before You Chase a Trillion-Dollar Cross
Here is the checklist applied to AMD. It works on the next chip stock that crosses a round number too.
- Does the growth rate match the multiple? AMD’s revenue grew 50% year over year, and its Q3 guide midpoint implies about 41%. The forward P/E needs EPS to rise about 1.5x to 2.2x from trailing levels, so growth near this pace has to continue, not just one strong quarter.
- Has the next platform actually shipped, or is it still a promise? Helios is AMD’s next AI-chip rack platform. In its Q2 release, AMD said Helios “begins to ramp” in the second half. The growth this multiple assumes depends on Helios shipments showing up as revenue, not just being announced.
- Is the price already ahead of the people who cover it for a living? Against MarketBeat’s roughly $565 average target, yes: the $615.52 close is 8.9% above it. Against S&P Global’s $618.51, no. Targets get revised and averages differ by provider, so check which analysts are counted.
- What single customer or catalyst is doing the lifting? We could not verify one AMD-specific announcement behind Monday’s jump. Every report we found points to sector-wide AI-chip momentum, not a single AMD deal — a rally with a diffuse cause is harder to unwind cleanly than one with a named trigger.
Two Lenses
The chip that finally closes the gap to Nvidia
AMD’s data center revenue rose 107% year over year, and, per CNBC, Su expects to double it in 2027.
For a market still hunting for “the next Nvidia,” a credible number-two AI-chip supplier crossing $1 trillion looks like confirmation, not speculation — proof the AI buildout has room for more than one winner.
The runway that hasn’t opened yet
The multiple already assumes Helios ships on schedule and at volume. CNBC put Nvidia’s market cap at about $5.4 trillion, more than five times AMD’s, built on years of shipped hardware. Paying about 72x forward earnings leaves little cushion if estimates fall because the ramp slips.
What Would Change Our View
We would treat AMD’s re-rating as earned, not just priced in, if Helios shipments show up as reported revenue and Q3 revenue (due Nov 3, per Investing.com) lands at or above AMD’s guide of about $13B, plus or minus $300M.
We would flag it as overextended if revenue lands below the $12.7B low end while the forward multiple stays near 72x.
FAQ
Q. Why did AMD’s stock jump about 10% in one day?
A. Reports point to broad AI-chip sector momentum during a five-day rally, not one AMD-specific announcement. We could not verify a single named catalyst for Monday specifically.
Q. Is AMD’s price already ahead of what analysts expect?
A. It depends on the source. The Sept 21 close of $615.52 sits about 8.9% above MarketBeat’s roughly $565 average target (Sept 16) and 8.4% above its $567.63 (Oct 1), but 0.5% below S&P Global’s $618.51 (Sept 30).
Q. What would make AMD’s current valuation look justified a year from now?
A. Helios platform shipments showing up as reported revenue at the pace already priced into a 72x forward P/E, without data center growth slowing first.
Q. What does AMD’s forward P/E imply about earnings growth?
A. At the Sept 21 close of $615.52, Investing.com’s forward P/E of 72.4x implies forward EPS of about $8.50. That is about 2.2x AMD’s trailing GAAP EPS of $3.89 and about 1.5x its trailing non-GAAP EPS of $5.76.
Sources
- AMD hits $1 trillion market cap for the first time — CNBC, Sep 2026
- AMD outlook: strong trend but elevated valuations raise consolidation risk — Investing.com, Sep 2026
- AMD Surpasses $1 Trillion Market Cap Amid AI Demand Surge — GuruFocus, Sep 2026
- AMD Stock Forecast: AI Demand, Analyst Targets and Key Levels to Watch — FX Leaders, Sep 2026
- AMD Reports Second Quarter 2026 Financial Results (EX-99.1) — AMD via SEC, Aug 4, 2026
- AMD Reports First Quarter 2026 Financial Results (EX-99.1) — AMD via SEC, May 5, 2026
- AMD Reports Fourth Quarter and Full Year 2025 Financial Results (EX-99.1) — AMD via SEC, Feb 3, 2026
- AMD historical prices — Yahoo Finance, retrieved Oct 2, 2026
- AMD stock forecast and price target — MarketBeat, retrieved Oct 2, 2026 (Oct 1 data)
- AMD stock forecast and price targets — StockAnalysis (S&P Global data), updated Sep 30, 2026
Correction, October 2, 2026. An earlier version gave AMD’s September 21 close as $613.31, up 9.6%, which was an intraday snapshot; the close was $615.52, up about 10%.
It also said the analyst target sat 8.5% below the price (about 8%), and cited a forward P/E of 68x and EV/Sales of 14.6x that the cited source does not show. The cited page shows a forward P/E near 72x.
Update, October 2, 2026. The title now says analyst average target, not AMD’s own. We replaced the unsourced $565.13 with MarketBeat’s roughly $565 (via FX Leaders), added S&P Global’s average, and added the earnings-growth derivation.
We also removed a Seeking Alpha quotation we could not verify and an unsupported depreciation sentence, and attributed the Nvidia market cap and 2027 data center claims to CNBC.
Leave a Reply